Computing in Cardiology Challenge
Goal
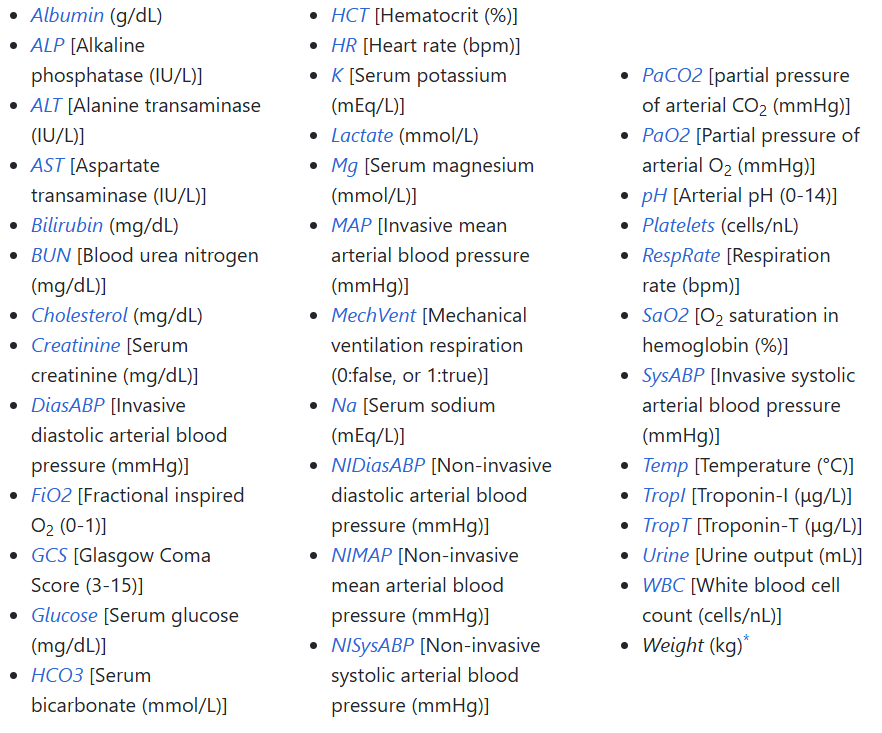
The goal of this project was to explore machine learning concepts by building a linear classifier using real-world data. The dataset, provided by Beth Israel Deaconess Medical Center in Boston, contains information on 12,000 patients. My task was to develop a model that could predict in-hospital mortality rates for patients. This problem is outlined in further detail here.
How it's Accomplished
Preparing the data: The dataset was missing values for some patient metrics, so I had to groom the data before using it. To accomplish this, I applied imputation and normalization.
Preparing the model: In order to identify the most important features, I used a Random Forest classifier. This narrowed down medical data that affected patient outcomes the most. After that, I ran tests to determine which kind of Logistic Regression model to use: L1 (Lasso) or L2 (Ridge) regularization.
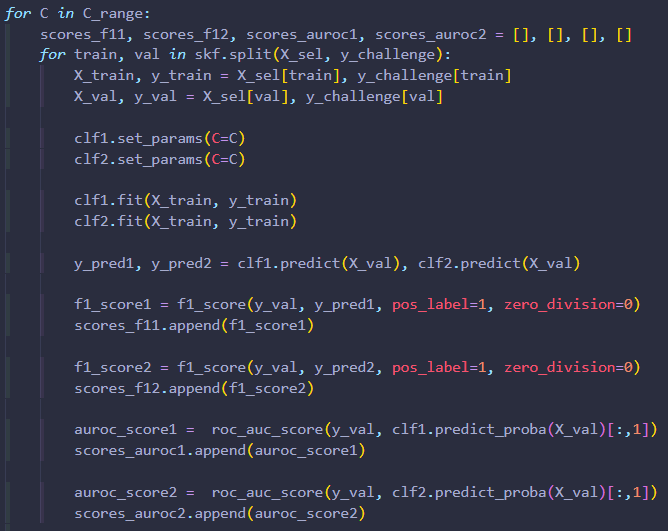
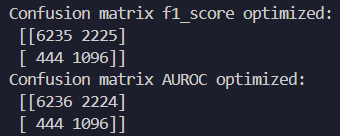
Training: To train the model, I used cross-validation. After training, I tested their performance using F1-score and AUROC diagnostics. This enabled me to identify which model had the best predictive capability! The key is to use most of the data for training, but setting some aside for testing generalizability.
Techniques Used
Imputation & Normalization: I used mean imputation to replace missing metrics with the average. Then normalization is used to put all of these metrics on an equal playing field by scaling them between 0 and 1. This step prevents a single feature from skewing results.
Random Forest Classifier: This is a machine learning model built into Python's sklearn which calculates the "most important" metrics. It builds decision trees by splitting data into branches that lead to patient outcomes, dying or surviving. Computing many of these trees, and averaging branches that have a greater affect on outcomes together, yields a more predictive tree. I was able to select metrics that affected patient outcomes more than average, and train models based on these metrics.
Logistic Regression: This is a term referring to a linear (straight-line relationship) model that performs binary (two possible outcomes) classification. It calculates the probability of an outcome based on the linear combination of input features. As mentioned before, there are two types that I experimented with in this project: L1 (Lasso) and L2 (Ridge) regularization. These terms refer to the ways in which a Linear Regression model can be simplified to more effectively predict data. An overly complicated model overfits training data and performs poorly on new test data.
Cross-Validation (Stratified K-Fold): This is a way to split data into multiple parts, or "folds", to train and test data. The model is trained on one fold at a time, up to however many are specified (typically five). It provides a reliable way to equally account for data within the set to reduce bias and overfitting.
Evaluation Metrics: F-1 Score measures precision and recall. This means that it checks how well the model predicts positive cases. Given that a positive case has serious implications, this is an important diagnostic. AUROC (Area Under the Receiver Operating Characteristic Curve) measures how well the model can distinguish between true positive and false positive cases. If the model's area score is 0.5, then it is totally random. If it achieves a score greater than 0.5, then it can reliably differentiate patient outcomes (typically 0.7-0.9).
Model Phases


